
Observability without the surgery: How to monitor your code without touching a single line of source.
eBPF: The “Superpowers” for Linux Kernel Observability

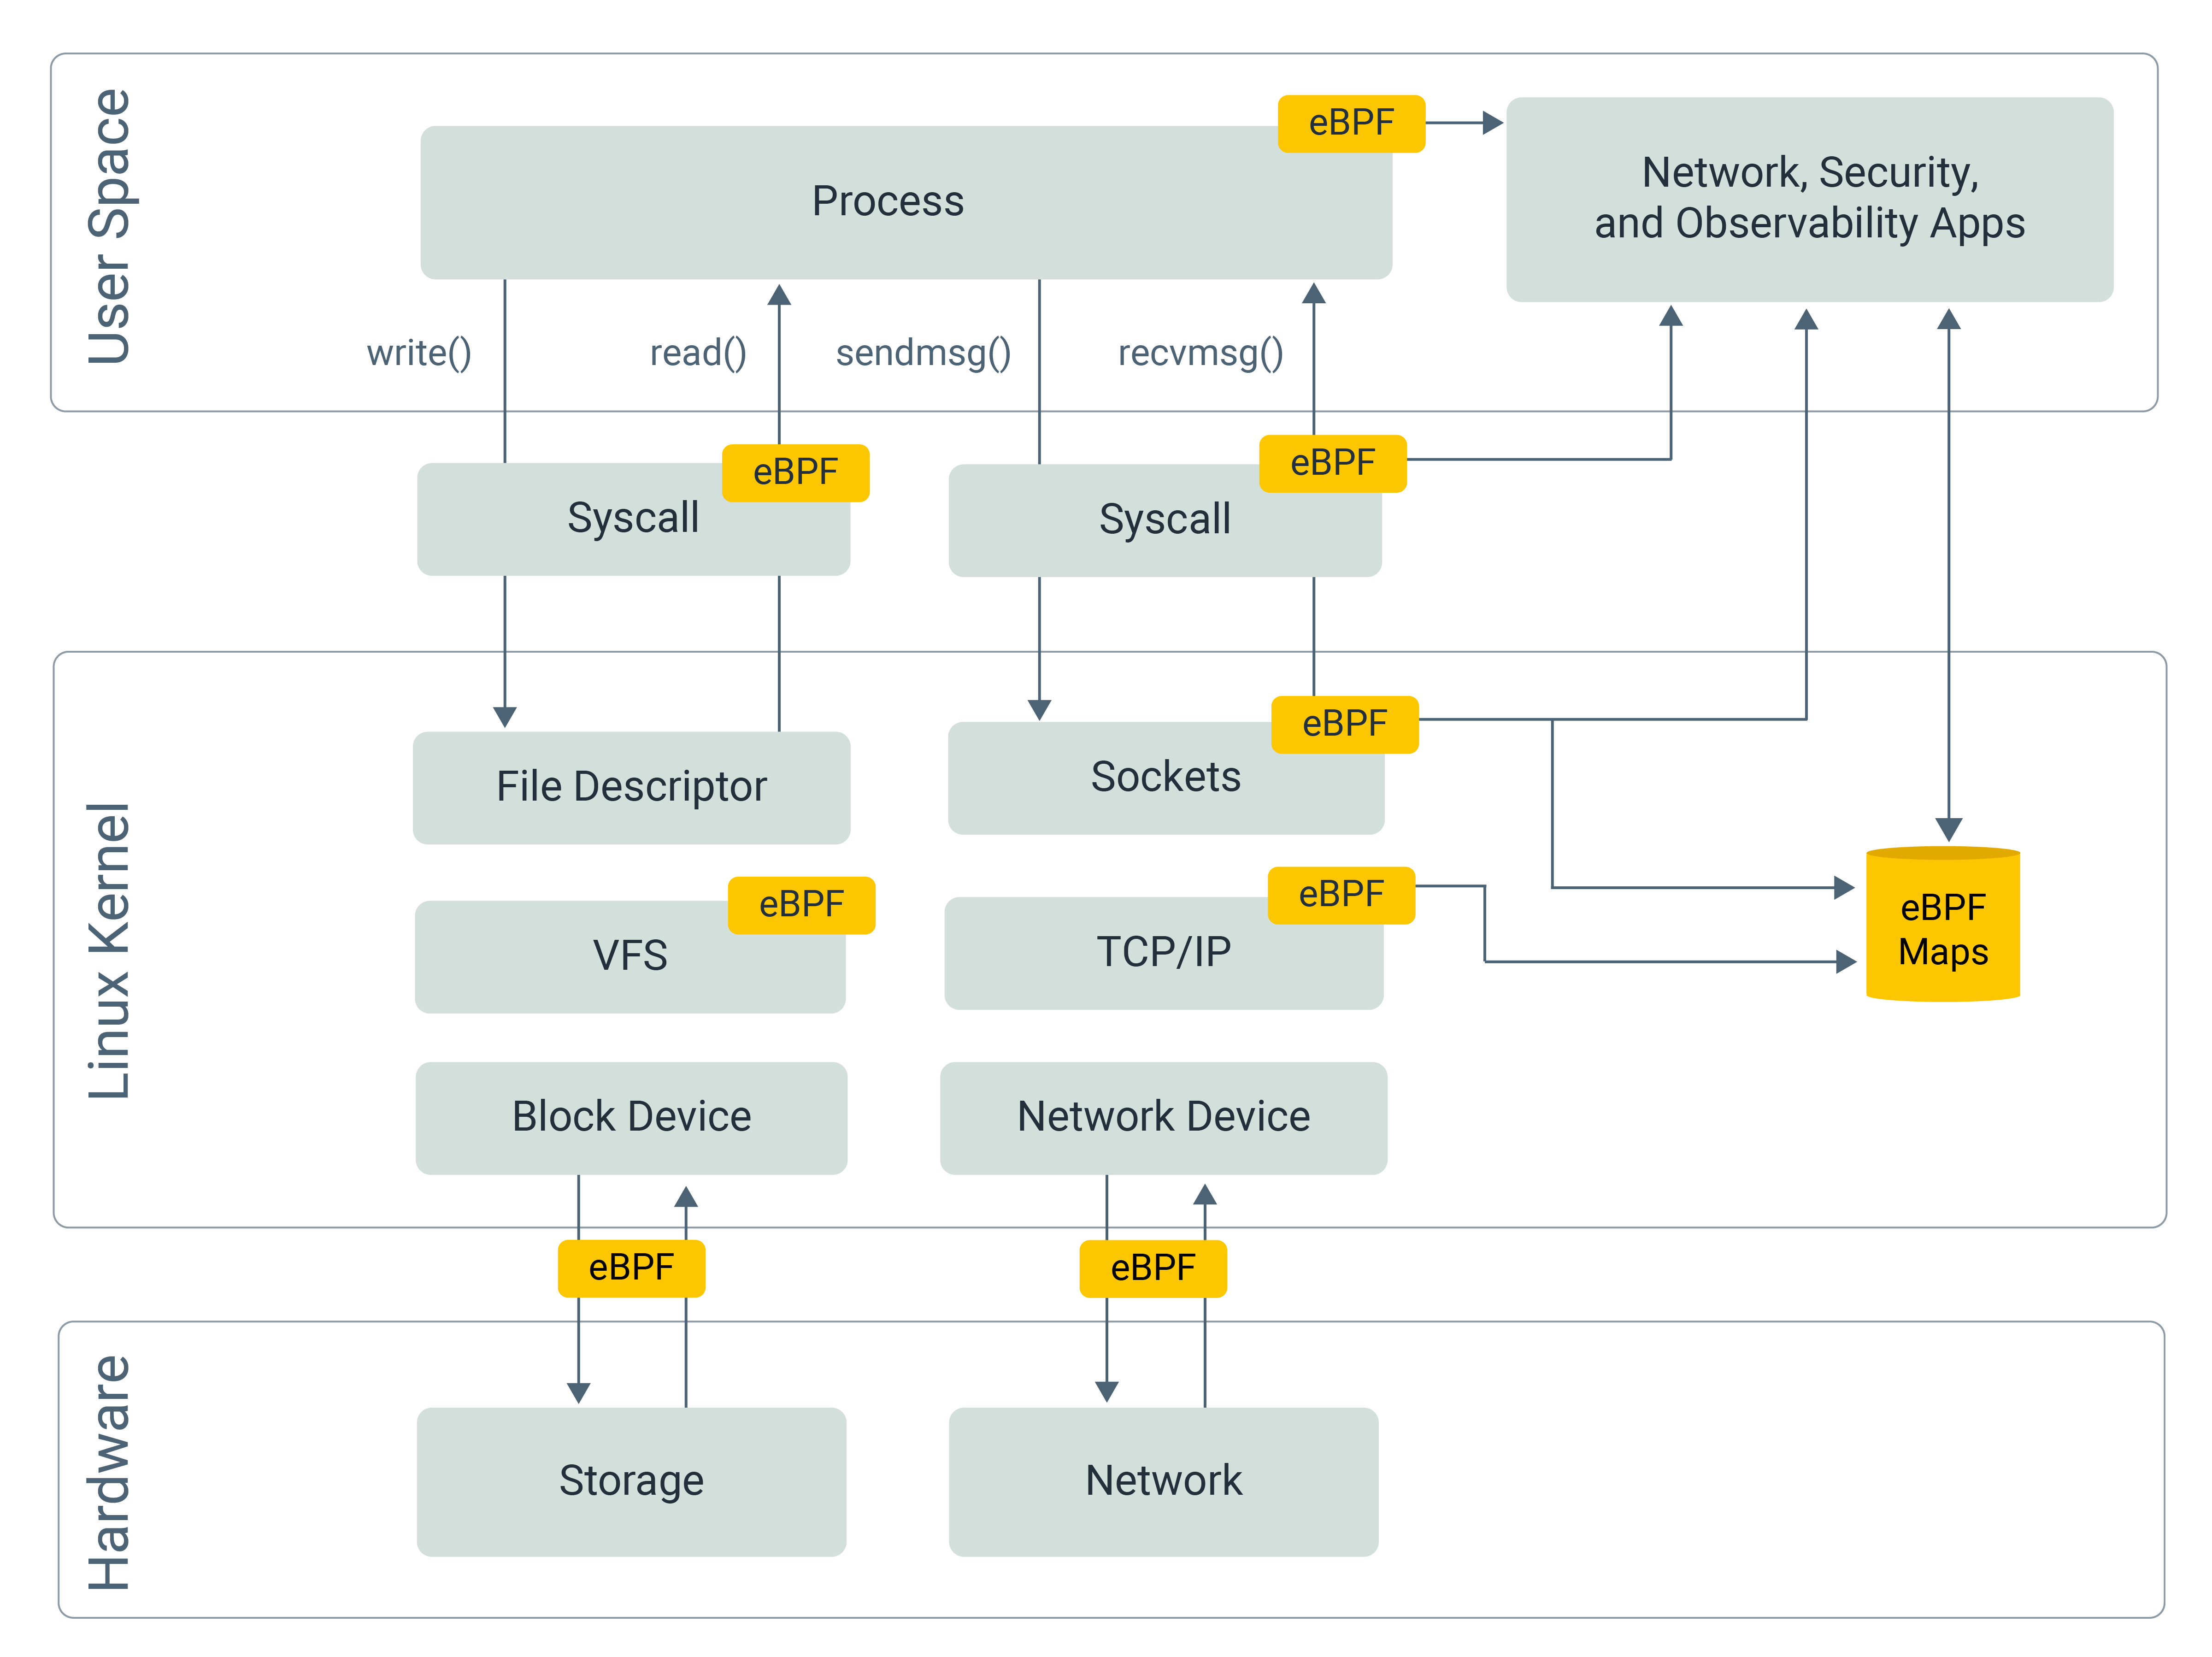
eBPF (Extended Berkeley Packet Filter) is a revolutionary technology that allows us to run sandboxed programs within the Linux kernel. It enables us to enhance system security and observability without modifying a single line of application code.
One of its most powerful features is real-time monitoring of CPU usage, memory allocation, and network packet inspection at the kernel level.
How to implement real-time monitoring without changing the code?
When an application runs, it interacts with hardware and resources via System Calls (syscalls). For example, read() and write() are used for File and Network I/O.
By attaching hooks to these syscalls, we can intercept them right before they execute or right after they finish. This allows us to collect execution parameters, return values, and precise timing data—all without the application ever knowing it’s being watched. For instance, hooking read() and write() allows you to monitor HTTP requests or database queries in real-time.
Isn’t it dangerous to hook the Kernel?
Arbitrarily inserting code into the kernel is extremely risky. A simple bug—such as a division by zero or an infinite loop—can crash the entire kernel and trigger a kernel panic, bringing down every process on the machine.
To make safe kernel extensibility possible, eBPF relies on a restricted programming model and strict verification, rather than trust.
Although eBPF programs can be written in C syntax, they are not general-purpose programs and must conform to strict compilation and verification constraints. During compilation, unsupported constructs—such as heap allocation (malloc) or unrestricted pointer usage—are rejected, because the eBPF instruction set simply does not support them.
After compilation, the resulting eBPF bytecode is passed to the kernel. Before it is allowed to execute, the eBPF verifier performs a full safety analysis. The verifier ensures that the program cannot consume unbounded resources—no infinite loops, no recursion, no excessive stack usage, and no unsafe memory access.
Finally, the eBPF program can be safely executed inside the kernel. At this stage, the kernel must be able to transform the verified eBPF bytecode into executable machine code.
Early eBPF implementations executed bytecode through an interpreter-based virtual machine. While functionally correct, interpretation introduced significant overhead and was unsuitable for performance-critical kernel paths.
Modern eBPF therefore relies on JIT compilation, which is capable of transforming eBPF bytecode into native machine code for the target CPU architecture, allowing eBPF programs to run at near-native speed within the kernel runtime.
How is the collected data stored?
Since eBPF programs are restricted, they cannot perform complex I/O operations (like writing directly to an external database). Instead, eBPF provides eBPF Maps—efficient data structures (Hash maps, Arrays, Ring Buffers, etc.) shared between the kernel and user space.
These maps can be accessed efficiently using mmap, a virtual memory mechanism that maps kernel-managed physical pages into the virtual address space of a user-space process.
With this approach, user-space programs can read data directly from memory, avoiding repeated read()-style system calls that would otherwise require copying data between kernel and user space.
Once the data is read from memory, the user-space program can then forward it to a database, monitoring system, or any other external service.
Can we monitor functions that don’t trigger System Calls?
Yes. While many eBPF hooks (like sk_msg) focus on the network or socket layers, eBPF also provides uprobes (User Probes).
Unlike syscall hooks, uprobes can modify the binary in memory. They insert a “trap” instruction at the entry and exit points of a specific function in your application.
When the process reaches a probed function, execution is interrupted by a trap that transfers control to the kernel, where the associated eBPF hook (e.g., using bpf_ktime_get_ns to record CPU time) is executed. This can happen both at function entry and at function return, allowing eBPF programs to observe execution before and after the function runs.
How can I start building with eBPF?
Let’s build a simple project that uses uprobes to measure a function’s execution time.
Prerequisites
Vagrant & Virtual Machine: eBPF is natively supported only on Linux. If you are using macOS or Windows, you must develop within a Linux environment (e.g., Ubuntu via Vagrant).
Clang & LLVM: BPF programs are written in C and compiled into bytecode using Clang/LLVM.
Go: We will use Go to write the user-space process that manages the eBPF lifecycle.
Step 1: Define eBPF Maps and Structures
First, we define a Hash Map to store function entry timestamps (indexed by Process ID), a Ring Buffer to transfer calculated durations to the user-space process, and an event struct to standardize the data format shared between the kernel and user space.
// Define a hash map to store start times; map name is "start_times"
struct {
    __uint(type, BPF_MAP_TYPE_HASH);
    __uint(max_entries, 1024);
    __type(key, u32);
    __type(value, u64);
} start_times SEC(".maps");

// Define a ring buffer to send events to user space; map name is "events"
struct {
    __uint(type, BPF_MAP_TYPE_RINGBUF);
    __uint(max_entries, 256 * 1024);
} events SEC(".maps");

// Define the event structure for data transfer
struct event {
    u32 pid;
    u64 start_time;
    u64 duration_ns;
};
Step 2 : write a eBPF program
The SEC macro is an eBPF-specific tool used to define the hook or section type for a specific block of code.
Entry Hook
This hook triggers at the start of the function, records the current timestamp, and stores it in the hash map.
SEC("uprobe")
int trace_func_entry(struct pt_regs *ctx) {
    // get current pid by removing lower 32 bits which is tid
    u32 pid = bpf_get_current_pid_tgid() >> 32;
    u64 ts = bpf_ktime_get_ns();

    // store the start time in the map
    bpf_map_update_elem(&start_times, &pid, &ts, BPF_ANY);
    bpf_printk("trace_func_entry hit: PID %d\n", pid);
    return 0;
}
Exit Hook
This hook triggers when the function returns. It calculates the elapsed time and submits the result to the ring buffer.
SEC("uprobe")
int trace_func_exit(struct pt_regs *ctx) {
    // get current pid by removing lower 32 bits which is tid
    u32 pid = bpf_get_current_pid_tgid() >> 32;
    u64 *start_ts = bpf_map_lookup_elem(&start_times, &pid);

    if (!start_ts) return 0;
    u64 end_ts = bpf_ktime_get_ns();
    // initialize and submit event to ring buffer
    struct event *e = bpf_ringbuf_reserve(&events, sizeof(*e), 0);
    if (e) {
        e->pid = pid;
        e->duration_ns = end_ts - *start_ts;
        bpf_ringbuf_submit(e, 0);
    }
    bpf_printk("trace_func_exit hit: PID %d\n", pid);

    // cleanup the start time from the map
    bpf_map_delete_elem(&start_times, &pid);
    return 0;
}
Step 3: Write the User-Space Process
The user-space process (written in Go) is responsible for:
Loading the eBPF bytecode into the kernel.
Attaching the
uprobehooks by resolving the binary path and function offsets.Initializing the ring buffer and consuming events for display.
We use the github.com/aquasecurity/libbpfgo library. Note that libbpfgo depends on libbpf (C library), so you must use CGO for compilation.
// Event definition shared with eBPF program
// struct event { u32 pid; u64 start_time; u64 duration_ns; };
type Event struct {
	Pid        uint32
	_          [4]byte // Padding for alignment
	StartTime  uint64
	DurationNs uint64
}

func main() {
	binaryPath := os.Args[1]
	symbolName := os.Args[2]

	_, err := os.Stat(binaryPath)
	if err != nil {
		terminate(fmt.Errorf("binary path error: %v", err))
	}

	// load eBPF object file
	bpfModule, err := libbpfgo.NewModuleFromFile("main.ebpf.o")
	if err != nil {
		terminate(err)
	}
	defer bpfModule.Close()

	// load eBPF program into the kernel
	if err := bpfModule.BPFLoadObject(); err != nil {
		terminate(err)
	}

	// get and attach Uprobe (Entry)
	entryProg, err := bpfModule.GetProgram("trace_func_entry")
	if err != nil {
		terminate(err)
	}

	offset, err := common.SymbolToOffset(binaryPath, symbolName)
	if err != nil {
		terminate(err)
	}

	probeLink, err := entryProg.AttachUprobe(-1, binaryPath, uint32(offset))
	if err != nil {
		terminate(fmt.Errorf("failed to attach uprobe: %v", err))
	}
	if probeLink == nil {
		terminate(fmt.Errorf("failed to attach uprobe: link is nil"))
	}
	defer probeLink.Destroy()

	// get and attach Uprobe (Exit)
	exitProg, err := bpfModule.GetProgram("trace_func_exit")
	if err != nil {
		terminate(err)
	}

	returnOffsets, err := FindReturnOffsets(binaryPath, symbolName)
	if err != nil {
		terminate(fmt.Errorf("failed to find return offsets: %v", err))
	}
	if len(returnOffsets) == 0 {
		terminate(fmt.Errorf("no return offsets found for symbol: %s", symbolName))
	}
	uretLink, err := exitProg.AttachURetprobe(-1, binaryPath, uint32(offset+returnOffsets[0]))
	if err != nil {
		terminate(fmt.Errorf("failed to attach uretprobe: %v", err))
	}
	if uretLink == nil {
		terminate(fmt.Errorf("failed to attach uretprobe: link is nil"))
	}
	defer uretLink.Destroy()

	// initialize Ring Buffer
	eventsChannel := make(chan []byte)
	rb, err := bpfModule.InitRingBuf("events", eventsChannel)
	if err != nil {
		terminate(err)
	}

	// start Ring Buffer polling
	rb.Poll(1000)

	// setup signal handling
	sigChan := make(chan os.Signal, 1)
	signal.Notify(sigChan, syscall.SIGINT, syscall.SIGTERM)
	fmt.Println("Tracing... Press Ctrl+C to stop.")
	ctx, cancel := context.WithCancel(context.Background())
	// event processing loop
	go func() {
		for {
			select {
			case <-ctx.Done():
				return
			default:
			}
			rawBytes := <-eventsChannel
			var event Event
			err := binary.Read(bytes.NewReader(rawBytes), binary.LittleEndian, &event)
			if err != nil {
				fmt.Printf("failed to decode received data: %v\n", err)
				continue
			}
			fmt.Printf("PID: %d | Function Duration: %v ms\n",
				event.Pid, float64(event.DurationNs)/1e6)
		}
	}()

	<-sigChan
	cancel()
	rb.Stop()
	fmt.Println("Exiting...")
}

func terminate(err error) {
	fmt.Fprintf(os.Stderr, "Error: %v\n", err)
	os.Exit(1)
}
Full Codebase
To simplify setup, you can access the entire codebase—including the Vagrant configuration and Makefile—at the link below: [https://github.com/vx416/ebpf_test]
Conclusion
eBPF enables safe, efficient, and real-time observability at the kernel level without requiring any modifications to the application code.
To leverage its power, we don't need to reinvent the wheel—we can rely on proven tools like:
Pyroscope: Utilizes eBPF to generate high-resolution, real-time CPU flame graphs for continuous profiling.
Pixie: A Kubernetes-native observability platform that uses eBPF to automate request tracing, database query profiling, and process-level CPU analysis.